Description
💻 Social Platform Analytics Dashboard 🔢
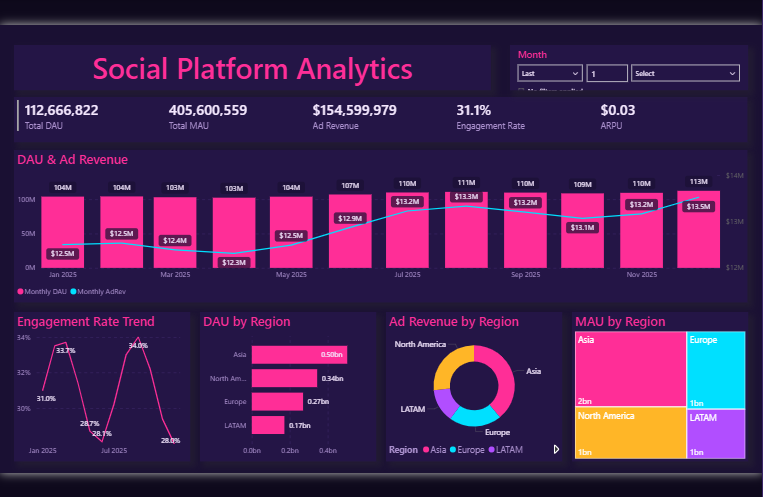
🪟 Theme: Synthwave Helix · Power BI
The Social Platform Analytics dashboard turns day-to-day technology & saas data into a clear, decision-ready view. Built on a sleek, dark Power BI canvas, it brings the metrics that matter — Total Daily Active Users, Total Monthly Active Users, Ad Revenue, Engagement Rate, Revenue per User and Monthly Daily Active Users — together on a single interactive page so trends, outliers and progress against target are obvious at a glance.
🧩 Key Features:
✅ Total Daily Active Users
✅ Total Monthly Active Users
✅ Ad Revenue
✅ Engagement Rate
✅ Revenue per User
✅ Monthly Daily Active Users
✅ Monthly Ad Revenue
✅ Headline KPI cards
✅ Interactive slicers & filters


