Description
🏥 Telehealth Network Dashboard 📉
🎚️ Theme: Care Link · Power BI
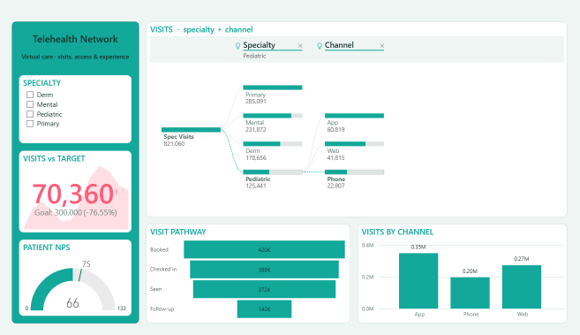
The Telehealth Network dashboard turns day-to-day healthcare data into a clear, decision-ready view. Built on a clean, light Power BI canvas, it brings the metrics that matter — Spec Visits, Monthly Visits, Visits Target, Total Net Promoter Score and Net Promoter Score Goal — together on a single interactive page so trends, outliers and progress against target are obvious at a glance.
⚡ Key Features:
✅ Spec Visits
✅ Monthly Visits
✅ Visits Target
✅ Total Net Promoter Score
✅ Net Promoter Score Goal
✅ Headline KPI cards
✅ Grouped column comparison
✅ Decomposition tree drill-down
✅ Conversion funnel