Description
🎓 University Enrollment Dashboard 📡
🖌️ Theme: Scholar Oak · Power BI
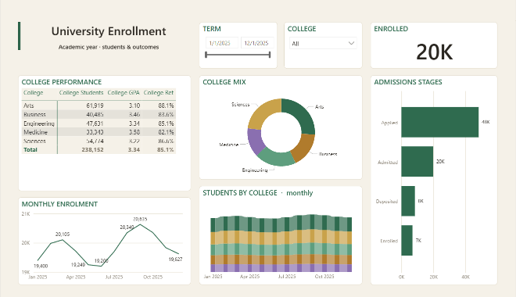
The University Enrollment dashboard turns day-to-day education data into a clear, decision-ready view. Built on a clean, light Power BI canvas, it brings the metrics that matter — Total Students, Monthly Students, College Students, College Retention and College GPA — together on a single interactive page so trends, outliers and progress against target are obvious at a glance.
🗂️ Key Features:
✅ Total Students
✅ Monthly Students
✅ College Students
✅ College Retention
✅ College GPA
✅ Headline KPI cards
✅ Interactive slicers & filters
✅ Ranked horizontal breakdown
✅ Trend lines over time


