Description
⚡ Upstream Oil & Gas Production Dashboard 💹
🌈 Theme: Sandstone Warm · Power BI
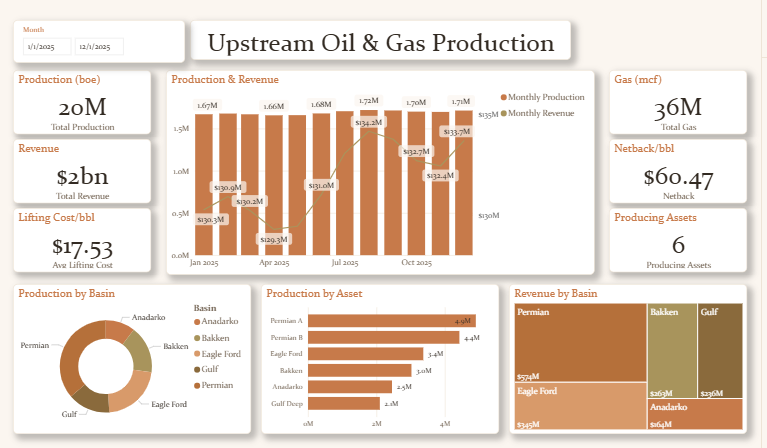
The Upstream Oil & Gas Production dashboard turns day-to-day energy & utilities data into a clear, decision-ready view. Built on a clean, light Power BI canvas, it brings the metrics that matter — Total Production, Total Revenue, Total Gas, Lifting Cost, Average Lifting Cost and Netback — together on a single interactive page so trends, outliers and progress against target are obvious at a glance.
🔆 Key Features:
✅ Total Production
✅ Total Revenue
✅ Total Gas
✅ Lifting Cost
✅ Average Lifting Cost
✅ Netback
✅ Producing Assets
✅ Headline KPI cards
✅ Interactive slicers & filters


